
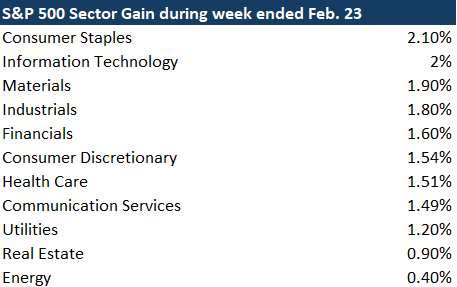
It’s fascinating how the market dynamics played out this week, isn’t it? Despite the notable rally in Big Tech stocks globally, it’s intriguing to see the broader market strength reflected in the S&P 500’s performance. The fact that all 11 sectors managed to finish in the green for the first time since November highlights a more widespread market optimism beyond just the tech sector.
This sort of breadth in market performance suggests a broader-based rally, where investors are finding value across various sectors rather than solely relying on the momentum of a few big names. It speaks to a more diversified and robust market sentiment, which can often be a positive sign for sustained market growth.
While the rally in Big Tech certainly played a significant role in boosting market confidence, the broader participation across sectors indicates underlying strength in the economy and investor sentiment. It’s a reminder of the interconnectedness of different sectors within the market and how their collective performance can drive overall market trends.
Sam Stovall, chief investment officer at CFRA, noted that the latest development is indicative of an improving market breadth, a factor that has been highlighted as a significant vulnerability by many Wall Street bears. Despite the continued focus on Big Tech, semiconductor stocks, and the artificial-intelligence craze, there’s a subtle improvement in market breadth.
“It’s like a rising tide lifts all boats. There is more participation in this advance. It’s more than just the ‘Magnificent Seven.’ This euphoria seems to be lifting up all of the sectors and a majority of the industries and stocks.”
Interestingly, information technology emerged as only the second-best-performing sector this week. This might surprise some investors, especially after Nvidia Corp.’s historic surge on Thursday following its latest blockbuster earnings report. The chip maker’s results triggered a global rally in shares of semiconductor stocks.
After the dust settled on Friday, the top performer was consumer staples, a defensive sector that has significantly trailed the S&P 500 — as well as communication services, information technology, and consumer discretionary, the three sectors housing the “Magnificent Seven” — over the past year. Consumer staples have seen a modest rise of 4.2% over the past 12 months, compared with the S&P 500’s robust 26.9% growth.
However, this week, consumer staples emerged as the leader, buoyed by companies like Costco Wholesale Corp., which climbed 1.9% through Friday to reach a record high, as per FactSet data.
While information technology garnered the lion’s share of attention, it was just one of three sectors that reached new all-time highs this week; the others were healthcare and industrials. Notably, healthcare includes high-performing Eli Lilly & Co., while the industrials sector lacks any of the top-10 stocks that have been credited with driving the majority of the S&P 500’s gains over the past year.
Beyond sectors and industries, a key indicator of market breadth suggests that more individual large-cap stocks are joining the rally. According to Dow Jones Market Data, the percentage of S&P 500 constituents trading above their 50-day moving average rose to over 67% on Friday, a notable improvement from the low of just under 51% observed on Feb. 13.
Vincent Randazzo, head of technical research at Lowry Technical Analysis, monitors various breadth indicators across the broader market, including midcap and small-cap companies. The Lowry Operating Companies Only gauge, which excludes preferred shares, closed-end bond funds, and ADRs, tracks the percentage of companies experiencing rising stock prices and those trading near their 52-week highs.
As of Thursday, the percentage of midcap companies trading at or near their 52-week highs had surged to 34%, a significant increase from the 5% observed when the S&P 500 hit its 52-week low in October. Likewise, large-cap stocks have seen a substantial turnaround, with 41% trading at or near 52-week highs as of Thursday, up from a mere 4% during the low.
“The market has been getting broader under the surface, despite the fact that those big names are still working really well,” Randazzo commented. The inclusion of midcap companies alongside their large-cap counterparts suggests that the rally may have room to continue. “You’re getting that second tier of participation as well,” Randazzo added.
However, small caps remain a potential concern, with only 13% trading near their 52-week highs. The Russell 2000 index of small-cap stocks was down 0.8% for the week and continues to languish in negative territory year-to-date following a brief but potent rally in November and December.
Interestingly, the broadening participation in the rally has coincided with more conservative expectations regarding the pace of Federal Reserve interest-rate cuts. Traders are now anticipating the first cut to occur in June, a delay from earlier projections suggesting a cut in March, according to fed-funds futures tracked by the CME.
Investors have adjusted their expectations for Federal Reserve interest-rate cuts, now anticipating four cuts by the end of the year, down from the previous projection of six. The shift in expectations coincided with a broad-based rally in stocks that commenced in November, spurred by indications from senior Fed officials that the central bank might alter its guidance away from a hiking bias, a move ultimately made by Chair Jerome Powell in December. This change triggered a rapid rally, briefly witnessing small caps outperforming their Big Tech counterparts.
One potential explanation for this market behavior is the strength of the U.S. economy. Despite a rebound in inflation in January, investors have noted a deceleration in goods inflation, with any hot spots in services easily explainable, according to James St. Aubin, chief investment officer at Sierra Mutual Funds. He remarked during an interview with MarketWatch that combined with robust economic growth, the Fed lacks a compelling reason for aggressive rate cuts. This scenario, St. Aubin argued, is favorable for stocks across various sectors, not just the secular growth names like Nvidia and Microsoft.
However, St. Aubin cautioned about the ongoing concentration of the market. He pointed out that the top-10 stocks still represent approximately 30% of the S&P 500’s total market capitalization, a level even higher than during the peak of the dot-com bubble.
The S&P 500 surged 1.7% this week to 5,088.80, marking its largest weekly gain since Jan. 12, according to Dow Jones Market Data. The Nasdaq Composite also rose by 1.4% to 15,996.82, while the Dow Jones Industrial Average gained 503.54 points, or 1.3%, reaching 39,131.53.